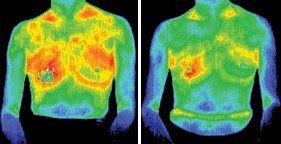
The most important relationship I seek to nurture in the treatment room is the one a patient has with their own body. We live in a culture that teaches us to override pain, defer to outside authority, and push through discomfort. Patients often arrive hoping I can “fix” them, but the truth is, we can’t do the work for them. We can offer guidance, insight and support, but healing requires their full participation.
Oscillating Nature of Recovery From Serious Sickness
It is common for acupuncturists to have a patient who complains of serious pain. After the first treatment, the patient will feel immediate relief from their serious pain. However, at the second visit, the patient would often say, "Although I felt relief temporarily, the pain returned." So no acupuncturist who I know ever promises that one acupuncture treatment will solve a serious pain problem.
It is interesting to consider what actually happens to the patient after their first treatment. Is their pain relief real or psychological? Does the patient imagine they are well because they have gone to see a doctor?
It is fortunate we now have a new kind of scientific instrument - an infrared imaging system that can document objectively the progress of serious pain as treatments go on for many weeks. Let me illustrate what is going on with pain reduction of patients from one treatment to the next, using practical examples with infrared images. The color code of infrared pictures ranges from white for the hottest, then red, yellow, green, blue and black for the coldest. The statistical fluctuation of skin temperature is about 0.5 F°.
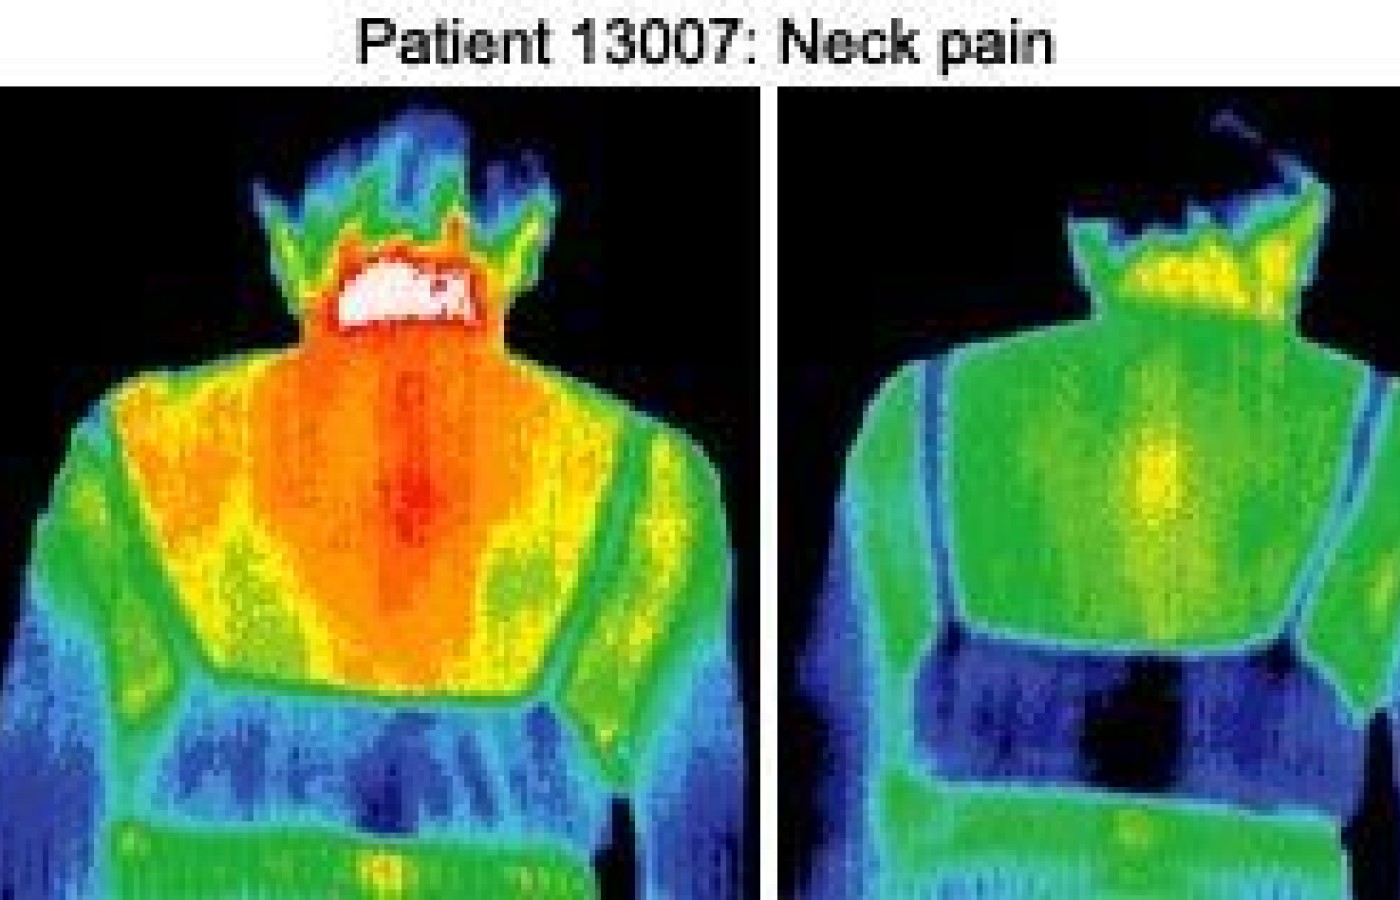
The first example was an 83-year-old female (patient 13007) who had neck pain for many years. The infrared imaging system showed that the place where the pain occurred was very hot, at 99.06 F°, which is shown below (Fig. 1a) as the white area. After healing with external qi, the hottest white area of the neck became slightly yellow at 94.52 F°, a much cooler temperature. The patient felt better after the healing session was over. The picture showed the pain area had reduced its temperature to almost normal, the same as the area below the neck. However, from our experiences, we knew that the neck pain would not be gone after just one session.
One week later, the patient came back and her pictures showed the neck as much hotter than the area around it. After a healing session with external qi, the hottest temperature of the neck reduced from 96.79 F° to 94.86 F°. So the maximum temperature for the neck was 99.06 F° before any healing started, and it was reduced to 94.52 F° after the session. Then it went up to 96.79 F° between healings. Then it reduced again, after another session, to 94.86 F°.
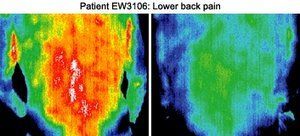
Fig. 1a shows the patient before healing with external qi. A similar picture of the neck is shown on the right (Fig. 1b), after 10 minutes of healing with external qi. The maximum temperature of the neck before healing was 99.06 F° and was reduced to 94.52 F° after healing. The decrease of maximum temperature was 4.54 F°. These pictures were taken on Jan. 30, 2007.
Fig 2a shows the patient before healing with external qi. A similar picture of the neck is shown on the right (Fig. 2b) after 10 minutes of healing with external qi. The maximum temperature of the neck before healing was 96.79 F° and was reduced to 94.86 F° after healing, with a decrease of 1.93 F°. These pictures were taken on Feb. 6, 2007.
This oscillation of maximum temperature is universally observed in all cases that I examined, whether the sickness was treated by external qi, acupuncture or herbs. Let me give you two more examples to illustrate this - one with lower back pain and another with multiple sclerosis.
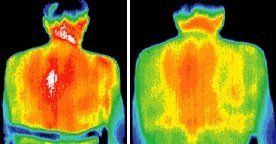
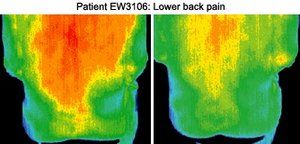
Patient EW3106 had back pain for many years. Finally, his wife convinced him to seek treatment. He chose to be healed with external qi. On the first healing session, infrared pictures were taken (shown below). The maximum temperature of his lower back was 97.44 F° before the session began. It was reduced to 94.37 F°. One of the later sessions showed the maximum temperature of his lower back had increased to 97.01 F°, which was then reduced to 95.61 F° after the healing, shown in Fig. 3 and Fig. 4 below.
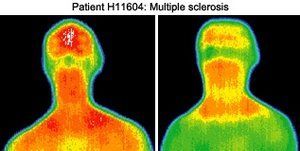
Fig. 3a shows the patient before healing with external qi. A similar picture of the lower back is shown on the right (Fig. 3b) after 10 minutes of healing with external qi. The maximum temperature of the lower back before healing was 97.44 F° and was reduced to 94.37 F° after healing. The decrease of maximum temperature was 3.07 F°. These pictures were taken on the first healing session.
Fig. 4a shows the patient before healing with external qi. A similar picture of the neck is shown on the right (Fig. 4b) after 10 minutes of healing with external qi. The maximum temperature of the neck before healing was 97.01 F° and was reduced to 95.61 F° after healing. The decrease of maximum temperature was 1.40 F°. These pictures were taken on a later healing session.
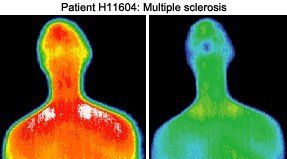
Patient H11604, a man in his seventies, had multiple sclerosis. He also chose to be healed by external qi. Before healing started, the maximum temperature on the face was 95.72 F°, which was reduced to 93.45 F° from the healing session. He received two sessions per week. After two months, infrared pictures were taken again, before and after each healing session. The maximum temperature of his face was 96.2 F°, which was reduced by healing to 91.84F. So it oscillated from 95.72 F° to 93.45 F°, back up to 96.2 F°, and then down again to 91.84 F°. These are shown below in Fig. 5 and Fig. 6.

Fig 5a shows the patient before healing with external qi. A similar picture of the face was shown on the right (Fig. 5b) after 10 minutes of healing with external qi. The maximum temperature of the face before healing was 95.72 F° and was reduced to 93.45 F° after healing. The decrease of maximum temperature was 2.27 F°. These pictures were taken on Nov. 6, 2004.
Fig 6a shows the patient before healing with external qi. A similar picture of the face is shown on the right (Fig. 6b) after 10 minutes of healing with external qi. The maximum temperature of the face before healing was 96.2 F° and was reduced to 91.84 F° after healing. The decrease of maximum temperature was 4.36 F°. These pictures were taken on Feb. 2, 2004.
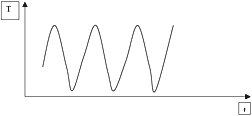
These oscillating patterns often repeat many times, represented graphically in Fig. 7. For example, if a person falls down the stairs, they may twist their neck and cause intense pain in the neck. The skin temperature of the pain area of the neck rises above the surrounding area. This represents the first peak of the curve. When healing occurs, either from external qi or acupuncture, or any other suitable modality; the temperature of the neck will drop very low to its first minimum. But after the effect of the first treatment wears off, the temperature of the pain area will rise again to its second peak. It is then ready to be treated for the second time. During the second treatment, the temperature of the painful area will again drop. After the effect of the second treatment wears off, the maximum temperature will rise again, making the area ready for the third treatment. And so on and so forth.
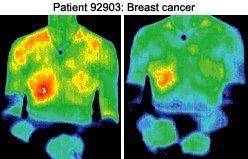
The ideal final treatment is when the temperature of the painful area will rise to be the same as the normal area surrounding the pain area. (In real life, this can hardly be documented in such detail, because the patient often stops continuation of the healing when they feel they have recovered sufficiently and not when the maximum temperature of the problem area becomes normal.)
Another outcome of the oscillating behavior of maximum temperature is that it does not go back to normal, but keeps on a steady pattern, as shown in Fig. 8.
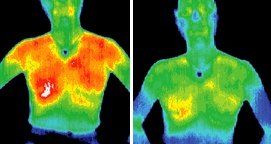
This was observed in patient 92903, who had breast cancer at an early stage. She chose to be treated by external qi, not with surgery or chemotherapy. Fig. 8 shows the oscillating nature of the maximum temperatures of her breast before and after her 5th, 15th, and 32nd healing session. The maximum temperature of her breast oscillated from 99.86 F° to 98.63 F° before and after the 5th session, from 100.68 F° to 97.49 F° before and after the 15th session, and then from 99.71 F° to 99.11 F° before and after the 32nd session. The maximum temperature of her right breast did not oscillate back to normal temperature of the surrounding area. But the maximum temperature did not increase significantly either. The patient interpreted this as being a steady state of her cancer that could be tolerated. She still could live and work with such a condition.
